
|
Getting your Trinity Audio player ready…
|
Mobile telephony company Netone was impressed that it gained subscriber and voice traffic market share according to the Postal and Telecommunications Sector Performance Report for the second quarter of 2021.
In an interview with Spiked Online Media, Roseline Chisveto, the NetOne Head of Marketing and Public Relations said her organisation will continue to be innovative so as to offer its customers the best of services.
“We attribute the good performance by NetOne to a number of programmes meant to offer seamless communication services to our customers. As you are aware, NetOne recently commissioned a USD71 million project which includes the construction of the wireless communication network, site energy provision, microwave transmission network, IP core network, network operation and maintenance system, and other supporting communication hardware and software facilities, and supporting engineering, throughout the country.
“My CEO, Mr Mushanawani recently expressed his gratitude to the Government of Zimbabwe through the Ministry of Information Communication Technologies and Courier Services for facilitating funding for this project. The two-year Phase III project will see NetOne increasing its foot print through the installation of 345 base stations in all corners of Zimbabwe thereby providing nationwide access to ICTs to all Zimbabweans. I am optimistic that we will continue to gain the ground as the leading network of choice,” Chisveto said.
Below, Spiked Online Media shares key highlights of the report as presented by POTRAZ Director-General, Dr. Gift Machengete:
The following are the main sector trends for the second quarter of 2021 compared to the first quarter of 2021:
- Active fixed telephone lines declined by 1.7% to record 245,322 in the second quarter of 2021 from 249,486 recorded in the first quarter of 2021; the fixed tele-density remained 1.7%.
- Active mobile telephone subscriptions increased by 3.9% to record 13.5 million in the second quarter of 2021, from 13 million recorded in the first quarter of 2021; the mobile penetration rate increased by 3.5% to reach 91.3% from 87.8% recorded in the first quarter of 2021.
- The total number of active Internet and data subscriptions increased by 1.9% to reach 9.2 million in the second quarter of 2021 from 9 million recorded in the previous quarter; the Internet penetration rate increased by 1.2% to reach 62.3% from 61.1% recorded in the previous quarter.
- Fixed telephone voice traffic increased by 3.3% to record 88.2 million minutes in the second quarter of 2021, from 85.5 million minutes recorded in the first quarter of 2021
- Total mobile voice traffic increased by 13.4% to record 1.77 billion in the second quarter of 2021 from 1.56 billion minutes recorded in the first quarter of 2021.
- Mobile Internet and data traffic increased by 7.2% to record 23,436 TB in the second quarter of 2021 from 21,865 Terabytes recorded in the first quarter of 2021.
- Used international incoming bandwidth capacity also increased by 3.8% to record 181,308Mbps in the second quarter of 2021 from 174,645Mbps recorded in the first quarter of 2021.
- Total postal and courier volumes increased by 20.3% to record 581,450 items in the second quarter of 2021 from 483,391 items recorded in the first quarter of 2021.
- Total mobile operator revenues grew by 22.2% to record ZWL16.9 billion in the second quarter of 2021 from ZWL13.8 billion recorded in the first quarter of 2021; on the other hand, operating costs grew by 15.8% to record ZWL8.8 billion from ZWL7.6 billion.
- Revenue generated by the fixed telephone network grew by 18.5% to record ZWL1.9 billion in the second quarter of 2021 from ZWL1.6 billion recorded in the first quarter of 2021; fixed network operating costs increased by 11.7% to record ZWL1.84 billion from ZWL1.65 billion recorded in the previous quarter.
- IAP revenues grew by 10.2% to record ZWL6 billion in the second quarter of 2021 from ZWL5.4 billion recorded in the first quarter of 2021; meanwhile, total operating costs for IAPs grew by 4% to record ZWL3.3 billion from ZWL3.2 billion.
- Total revenue generated by the postal and courier sector increased by 28.3% to record ZWL344.9 million in the second quarter of 2021 from ZWL267.8 million recorded in the first quarter of 2021; operating costs increased by 18.4% to record ZWL337.8 million from ZWL285.2 million recorded in the first quarter of 2021.
1. MOBILE TELEPHONY
1.1 MOBILE SUBSCRIPTIONS
The total number of active mobile telephone subscriptions increased by 3.9% to reach 13,481,527 in the second quarter of 2021 from 12,970,615 recorded in the first quarter of 2021. As a result, the mobile penetration rate increased by 3.5% to reach 91.3% from 87.8% recorded in the first quarter of 2021. All the mobile operators recorded growth in active subscriptions, in varying magnitudes, as shown in table 1 below:
Table 1: Active Mobile Subscriptions
| Operator | 1st Quarter 2021 | 2nd Quarter 2021 | Variance (%) |
| Econet | 8,668,095 | 8,872,214 | 2.4% |
| NetOne | 3,721,416 | 4,027,009 | 8.2% |
| Telecel | 581,104 | 582,304 | 0.2% |
| Total | 12,970,615 | 13,481,527 | 3.9%
|
As shown above, NetOne recorded the biggest growth in active subscriptions in the quarter under review. Prepaid subscriptions constituted 97.4% of total active subscriptions. Prepaid subscriptions recorded growth in the 2nd quarter of 2021 whereas post-paid subscriptions declined as shown in Table 2 below:
Table 2: Prepaid vs Post-paid Mobile Subscriptions
| 1st Quarter 2021 | 2nd Quarter 2021 | Variance (%) | |
| Prepaid | 12,602,828 | 13,130,464 | 4.2% |
| Post-paid | 367,787 | 351,063 | -4.5% |
| Total | 12,970,615 | 13,481,527 | 3.9%
|
Post-paid subscriptions have been declining as consumers migrate to the prepaid platform to enjoy lower tariffs from promotions on the prepaid platform. A quarterly comparison of the market share of active mobile subscriptions is shown in Figure 1 below:
Figure 1: Market Share of Mobile Subscribers
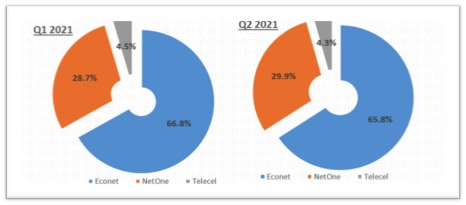
As shown above, Telecel and Econet lost market share by 0, 2% and 1% respectively, whereas NetOne gained market share by 1, 2%.
1.2 MOBILE VOICE TRAFFIC
Total mobile voice traffic increased by a considerable 13.4% in the second quarter of 2021 as shown in table 3 below:
Table 3: Mobile Telephone Traffic
| Traffic Category | 1st Quarter 2021 | 2nd Quarter 2021 | Variance (%) |
| Net on Net | 1,161,831,655 | 1,297,791,115 | 11.7% |
| Mobile to Fixed | 3,920,851 | 4,273,887 | 9% |
| Incoming from Fixed | 65,350,528 | 69,642,202
|
6.6% |
| Mobile to Other Mobile (by termination) | 267,905,778 | 336,715,415 | 25.7% |
| Outgoing to IAPs | 2,326,936 | 1,882,696 | -19.1% |
| Incoming from IAPs | 26,578,501 | 27,213,466 | 2.4% |
| TOTAL NATIONAL | 1,527,914,249 | 1,737,484,071 | 13.7% |
| International Incoming | 27,157,480 | 26,221,498 | -3.4% |
| International Outgoing | 5,595,350 | 6,192,581 | 10.7% |
| Inbound Roaming | 525,790 | 697,970 | 32.7% |
| Outbound Roaming | 140,287 | 425,075 | 203% |
| Total | 1,561,333,156 | 1,771,025,157 | 13.4% |
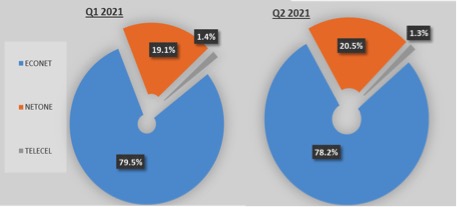
Outbound roaming traffic recorded the biggest growth as shown above. This may be attributable to increased cross-boarder travelling following the opening up of boarders to the vacinnated population. International incoming traffic recorded a consecutive decline whereas international outgoing traffic has been increasing, implying a decline in foreign currency earnings from international voice service. A quarterly comparison of the voice traffic market share is shown in Figure 2 below:
Figure 2 Voice traffic Market Share
1.3 MOBILE INTERNET & DATA
Mobile Internet and data traffic increased by 7.2% to record 23,436 TB in the second quarter of 2021 from 21,865 Terabytes recorded in the first quarter of 2021. Of the total mobile Internet and data traffic, 1,521,111 MB were consumed by inbound roaming subscribers whereas 192,403 MB were consumed by outbound roaming subscribers. In-bundle data constituted 97.3% of total mobile Internet and data usage, up from 97.2% recorded in the first quarter of 2021.
1.4 MOBILE REVENUES, COSTS & INVESTMENT
A 22.2% growth in mobile operator revenues was recorded in the second quarter of 2021 with revenues totalling ZWL16.9 billion from ZWL13.8 billion recorded in the first quarter of 2021. The growth in revenue is attributable to the growth in voice as well as Internet and data traffic.There was no major change in the revenue contribution per service.
Telecel and Econet lost revenue market share by 3% and 0.1% respectively whereas NetOne gained revenue market share by 3.1%. Operating costs grew by 15.8% to record ZWL8.8 billion in the second quarter of 2021 from ZWL7.6 billion recorded in the first quarter of 2021.
Table 4: Mobile Network Operating Costs
|
Operator |
Operating costs (ZWL) |
|||
| 1st Quarter 2021 | 2nd Quarter 2021 | Variance | ||
| Econet | 5,655,507,436 | 6,571,847,385 | 16.2% | |
| NetOne | 1,718,868,113 | 1,893,676,144 | 10.2% | |
| Telecel | 287,031,929 | 407,810,333 | 42.1% | |
| Total | 7,661,407,478 | 8,873,333,862 | 15.8% | |
The growth in operating costs is attributable to the inflationary pressures in the economy. Staff costs, depreciation and bandwidth costs continued to constitute the bulk of mobile network operating costs.
1.5 MOBILE TELEPHONY INFRASTRUCTURE
The total number of base stations in the country reached 9,048 in the second quarter of 2021, up from 8,996 recorded in the first quarter, following the deployment of 52 additional base stations. The growth in base stations is shown in Table 5 below:
|
Operator |
2G | 3G | LTE | ||||||
| Q1
2021 |
Q2
2021 |
Net Addition | Q1
2021 |
Q2
2021 |
Net Addition | Q1
2021 |
Q2
2021 |
Net Addition | |
| Econet | 2,640 | 2,654 | 14 | 1,653 | 1,667 | 14 | 726 | 726 | – |
| Telecel | 664 | 671 | 7 | 437 | 437 | – | 17 | 17 | – |
| NetOne | 1,667 | 1,667 | – | 845 | 853 | 8 | 347 | 356 | 9 |
| Total | 4,971 | 4,992 | 21 | 2,935 | 2,957 | 22 | 1,090 | 1,099 | 9 |
As shown above, all the mobile operators deployed additional base stations in the second quarter of 2021.
The changes in the mobile network population coverage, owing to the new deployments, is shown in table 6 below:
Table 6: Mobile Network Population Coverage
|
1st Quarter 2021 |
2nd Quarter 2021 |
Variance |
||
| 2G | Rural | 74.71% | 74.76% | 0.05% |
| Urban | 99.87% | 99.87 | – | |
| Total | 93.45% | 93.47% | 0.02% | |
| 3G | Rural | 67.19% | 67.22% | 0.03% |
| Urban | 99.90% | 99.91% | 0.01% | |
| Total | 83.95% | 83.97% | 0.02% | |
| 4G | Rural | 1.83% | 1.84% | 0.01% |
| Urban | 91.99% | 91.99% | – | |
| Total | 34.98% | 34.99% | 0.01% | |
2. FIXED TELEPHONE SERVICE
2.1 SUBSCRIPTIONS
The total number of active fixed telephone lines as at 30 June 2021 was 245,322. This represents a 1.7% decline from 249,486 recorded in the first quarter of 2021. The decline emanated from the decline in corporate subscriptions as shown in table 7 below:
Table 7: Fixed Telephone Subscriptions
| Subscriber category | 1st Quarter 2021 | 2nd Quarter 2021 | % Growth |
| Residential | 144,110 | 144,487 | 0.3% |
| Corporate | 105,376 | 100,835 | -4.3% |
| Total Active | 249,486 | 245,322 | -1.7% |
The fixed tele density remained at 1.7%. The fixed network continues to face competition from emerging technologies such as Voice over Internet Protocol (VoIP), hence the decline in active subscriptions over the years. Corporate subscriptions have declined in the last three consecutive quarters as shown in figure 7 below:
Figure 7: Corporate Fixed Telephone Subscriptions
2.2 FIXED NETWORK TRAFFIC
Fixed telephone voice traffic increased by 3.3% to record 88.2 million minutes in the second quarter of 2021, from 85.5 million minutes recorded in the first quarter of 2021. The growth in fixed voice traffic per category is shown in table 8 below:
| Traffic category | 1st Quarter 2021 | 2nd Quarter 2021 | Variance
|
| Net on Net | 10,553,116 | 8,584,630 | -18.7% |
| Outgoing to Mobile | 65,363,017 | 69,642,202 | 6.5% |
| Incoming from Mobile | 3,973,603 | 4,273,887 | 7.6% |
| Incoming from IAPs | 615,697 | 761,240 | 23.6% |
| Outgoing to IAPs | 644,214 | 768,589 | 19.3% |
| Total National Voice Traffic | 81,149,647 | 84,030,548 | 3.6% |
| International Incoming | 3,068,483 | 3,096,910 | 0.9% |
| International Outgoing | 1,233,283 | 1,101,327 | -10.7% |
| Total traffic | 85,451,413 | 88,228,785 | 3.3% |
As shown above, net-on-net and international outgoing traffic were the only two fixed voice traffic categories to record negative growth in the second quarter of 2021. Fixed net-on-net traffic for the greater part of 2020 and 2021 has generally been fluctuating and much lower than in previous years. The bulk of fixed on-net is generated by corporates, hence the decline may be attributable to closure of some corporate offices as well as the shift to shorter business hours as part of COVID-19 prevention measures.
2.3 FIXED TELEPHONE REVENUES, INVESTMENT & COSTS
Fixed network revenue, operating costs and capital expenditure for the second quarter of 2021 are indicated in table 9 below:
Table 9: Fixed Voice Revenue, Investment & Costs
| 1st Quarter 2021
(ZWL) |
2nd Quarter 2021
(ZWL) |
Variance (%) | |
| Revenue | 1,565,430,696 | 1,854,758,311 | 18.5% |
| ARPU per month | 2,085 | 2,522 | 21.0% |
| Operating Costs | 1,651,557,614 | 1,844,998,819 | 11.7% |
| ACPU per month | 2,199 | 2,508 | 14.1% |
| Investment | 99,759,985 | 141,472,848 | 41.8% |
As shown above, growth in revenues, operating costs and capital expenditure was recorded in the second quarter of 2021. The growth in revenue is attributable to an increase in usage traffic, whilst the increase in operating costs and is attributable to inflationary pressures.
The contribution of data grew marginally (0.1%), whereas the contribution of voice declined by 2.3%. Data has become the main revenue contributor for the fixed network as demand for Internet and data continues to be on an upward trajectory.
3. DATA & INTERNET SERVICES
3.1 SUBSCRIPTIONS
A 1.9% growth in active Internet and data subscriptions was recorded in the second quarter of 2021. The growth in active data and Internet subscriptions by technology is shown in table 10 below:
Table 10: Active Internet Subscriptions
| Technology | 1st Quarter 2021 | 2nd Quarter 2021 | Variance (%) |
| 3G/HSDPA/LTE | 8,847,103 | 9,020,133 | 2.0% |
| Leased Lines | 1,135 | 1,194 | 5.2% |
| DSL | 111,057 | 110,996 | -0.1% |
| WiMAX | 1,547 | 1,552 | 0.3% |
| CDMA | 12,824 | 12,366 | -3.6% |
| VSAT | 2,013 | 1,989 | -1.2% |
| Active Fibre Subscriptions | 53,965 | 55,549 | 2.9% |
| Total | 9,029,644 | 9,203,779 | 1.9% |
As shown above, VSAT, CDMA and DSL were the categories that recorded a decline in active subscriptions. Whilst other internet and data technologies have been fluctuating over the past quarters, Fibre and mobile Internet data have generally been on the increase. The total number of subscribers who used LTE in the second quarter of 2021 was 1,061,576. This represents a 9.9% increase from 966,320 subscriptions recorded in the first quarter of 2021. The growth in fibre subscriptions, broken down by subscription type, is shown in table 11 below:
Table 11: Active Fibre Subscriptions
| 1st Quarter 2021 | 2nd Quarter 2021 | Variance
|
|
| Corporate | 6,668 | 6,748 | 1.2% |
| Residential | 47,297 | 48,801 | 3.2% |
| Total | 53,965 | 55,549 | 2.9% |
As shown above, both residential and corporate fibre subscriptions increased in the second quarter of 2021.
3.2 INTERNATIONAL INTERNET CONNECTIVITY
Dandemutande was the only Internet Access Provider (IAP) to expand their international internet bandwidth capacity as shown in table 12 below:
Table 12: Equipped International Internet Bandwidth Capacity (Mbps)
| 1st Quarter 2021 | 2nd Quarter 2021 | Variance (%) | |
| Liquid | 260,000 | 260,000 | – |
| TelOne | 87,500 | 87,500 | – |
| Powertel | 5,000 | 5,000 | – |
| Dandemutande | 3,416 | 4,161 | 21.8% |
| Total | 355,916 | 356,661 | 0.2% |
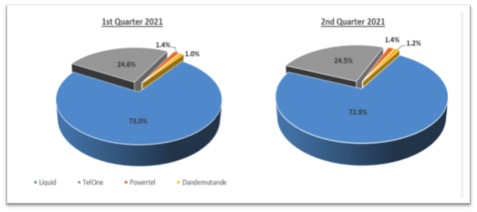
There was a slight movement in the market share of equipped international Internet bandwidth capacity as shown in figure 9 below, due to the expansion by Dandemutande.
There was an increase in used international incoming bandwidth capacity as shown in table 13 below:
Table 13: Used International Internet Bandwidth Capacity
| 1st Quarter 2021 | 2nd Quarter 2021 | Variance (%) | |
| Incoming | 174,645 | 181,308 | 3.8% |
| Outgoing | 46,787 | 49,753 | 6.3% |
Used international internet bandwidth will continue to grow as the uptake of internet and data increases. The growth in outgoing international internet bandwidth capacity implies an increase in local online content accessed outside our borders in the quarter under review.
3.3 IAP REVENUES, OPERATING COSTS & INVESTMENT
Total revenue by Internet Access Providers recorded a 10.2% growth, operating costs grew by 4%, whilst capital expenditure also increased by 3.1% as shown in table 14 below:
Table 14: IAP Revenues, Operating Costs (ZWL)
| 1st Quarter 2021 | 2nd Quarter 2021 | Variance (%) | |
| Revenue | 5,418,880,9961 | 5,970,777,750 | 10.2% |
| Operating Costs | 3,198,113,147 | 3,325,428,267 | 4.0% |
| Capital Expenditure | 268,891,409 | 277,282,169 | 3.1% |
IAP revenues have been consistently growing due to the growing demand for Internet and data.
Liquid continued to dominate the market. However, in the second quarter of 2021, their revenue market share declined by 1.1%. Powertel and Africom`s market shares also declined by 1.1% and 0.1% respectively. On the other hand, TelOne, Dandemutande and Telco`s market shares grew by 1.6%, 0.5% and 0.1%, respectively. DFA a recently licensed IAP had 0.1%. in relation to the other Internet Access Providers owing to a 62.3% growth in their revenue. Africom also recorded a 0.2% growth in the revenue market share.
4. POSTAL & COURIER
4.1 POSTAL & COURIER VOLUMES
The trend of growing postal and courier volumes continued into the quarter under review. Total postal and courier volumes increased by 20.3% to record 581,450 items in the second quarter of 2021 from 483,391 items recorded in the first quarter of 2021. The growth in total volumes emanates from a surge in international incoming courier as shown in table 15 below:
Table 15: Postal and Courier Volumes
|
1st Quarter 2021 |
2nd Quarter 2021 |
% Growth |
|
| Domestic postal letters | 238,038 | 274,634 | 15.4% |
| Domestic courier | 123,791 | 103,372 | -16.5% |
| International incoming courier | 96,671 | 182,663 | 89.0% |
| International outgoing courier | 24,891 | 20,781 | -16.5% |
| Total Postal & Courier | 483,391 | 581,450 | 20.3% |
After suffering setbacks from the global COVID-19 pandemic, postal and courier volumes have been steadily rising over the past four quarters as shown in figure 11 below:
Figure 11: Postal & Courier Volumes
Postal and courier volumes are expected to pick up as the ease of channelling courier items to and from several destinations improves post-lockdown. The application of COVID-19 restrictions affected the channelling of mail and caused a huge dip in mail volumes globally. Despite the growth recorded in the quarter under review, postal and courier volumes are still way below the quarterly average of over 1 million prior to the COVID-19 era.
4.2 POSTAL & COURIER REVENUES, COSTS & INVESTMENT
Total revenue generated by the postal and courier sector increased by 28.3% to record ZWL344.9 million in the second quarter of 2021 from ZWL267.8 million recorded in the first quarter of 2021. This is largely attributed to increased mail volumes. Operating costs and capital expenditure grew by 18.4% and 22.6% respectively as shown in table 16 below:
Table 16: Postal & Courier Revenues, Costs & Investment
|
1st Quarter 2021 |
2nd Quarter 2021 |
Variance |
|
| REVENUES | 268,757,592 | 344,856,896 | 28.3% |
| OPERATING COSTS | 285,180,736 | 337,765,699 | 18.4% |
| INVESTMENT | 5,640,142 | 6,914,374 | 22.6% |
The capital expenditure was mainly in delivery vehicles. Administration costs, line haul costs and transit charges formed the bulk of postal and courier operating costs.
5. OUTLOOK
The sector continues to be critical in keeping the economy running in the midst of the COVID-19 pandemic by providing business-critical connectivity and resilience, facilitating work-from-home arrangements, e-banking, e-commerce, as well as keeping individuals and societies connected and informed during mandated social isolation periods. This has, however, resulted in an unparalleled surge in the use of the Internet in providing e-services, such as e-learning, e-shopping, e-worshiping and e-health, amongst others. Indeed, the pandemic has shone light on the urgent need for accelerating digital transformation. Never before in our lifetime have circumstances changed so fast, and has there been a greater need to adapt. This calls for concerted efforts in the consolidation of strategies that deliberately focus on ICT development, executing smart policies and effective processes that embolden investments in ICTs and digital skills, and embracing emerging technologies that are crucial to the digital economy.
The shift to the auction based foreign currency market system seemingly eased inflationary pressures, but did not eliminate them completely as prices for goods and services, including fuel and energy, continued to be adjusted in line with the dynamics of the new exchange rate regime. Notwithstanding the above, foreign currency shortages continued to bedevil the economy at large, with implications on network expansion, upgrade and maintenance, taking a toll on quality of service as demand for data surged for operators.
The COVID-19 pandemic will not to go away so soon but its spread will decrease owing to ongoing vaccinations across the globe and at national level. The anticipated increase in economic activity will bring about a further surge in demand for communication services, in particular data and courier volumes as consumers adapt to the new normal. Hence, the need to scale up digitalisation.