

|
Getting your Trinity Audio player ready...
|
Dr. Gift Machengete, the Director-General of the Postal and Telecommunication Regulatory Authority of Zimbabwe today delivered the 2021 Postal and Telecommunication Sector report as shown below:
MAJOR HIGHLIGHTS
The following are the main sector trends for the fourth quarter of 2021 compared to the third quarter of 2021:
- Active fixed telephone lines declined by 4% to reach 243,421 from 244,316 recorded in the third quarter of 2021; the fixed teledensity remained 1.6%.
- The total number of active mobile subscriptions increased by 2.3% to reach 14,257,590 from 13,935,233 recorded in the third quarter of 2021; the mobile penetration rate increased by 0.9% to reach 94.4% from 93.5% recorded in the third quarter of
- The total number of active Internet and data subscriptions increased by 2.3% to reach 9.5 million from 9.3 million recorded in the third quarter of 2021; the Internet penetration rate increased by 0.5% to reach 63.1% from 62.6% recorded in the previous
- Fixed telephone voice traffic increased by 5.7% to record 92.1 million minutes, from 87.1 million minutes recorded in the third quarter of
- Total mobile voice traffic declined by 14.3% to record 1.8 billion minutes from 2.1 billion minutes recorded in the third quarter of 2021. Inbound and outbound roaming traffic increased by 96.8% and 34.9%
- Mobile Internet and data traffic declined by 3.5% to record 24,991TB from 25,902TB recorded in the third quarter of
- Used international incoming bandwidth capacity increased by 3.4% to record 195,158Mbps, from188,768Mbps recorded in the third quarter of
- Total postal and courier volumes declined by 11.7% to record 642,432 items, from 732,303 items recorded in the third quarter of
- Total mobile operator revenues grew by 34% to record ZW26,174,511,133 from ZWL19,537,428,10 recorded in the third quarter of 2021; On the other hand, operating costs grew by 10.9% to record ZWL13,869,570,869 from ZWL12,506,516,547.
- Revenue generated by the fixed telephone network grew by 35% to record ZWL3,136,189,992, from ZWL2,322,491,003 recorded in the third quarter of 2021; operating costs increased by 40% to record ZWL2,922,862,246 from ZWL2,088,368,300 recorded in the previous
- IAP revenues grew by 27.8% to record ZWL9,284,401,505, from ZWL7,266,119,186 recorded in the third quarter of 2021; meanwhile, operating costs for IAPs grew by 7.4% to record ZWL5,126,047,336 from ZWL5,126,047,336 billion recorded in the previous
- Total revenue generated by the postal and courier sector increased by 3.1% to record ZWL468,262,927, from ZWL454,097,831 recorded in the third quarter of 2021; Operating costs grew by an even higher margin of 9.7% to record ZWL401.9 million from ZWL366.3 million.
1. MOBILE TELEPHONY
1.1 MOBILE SUBSCRIPTIONS
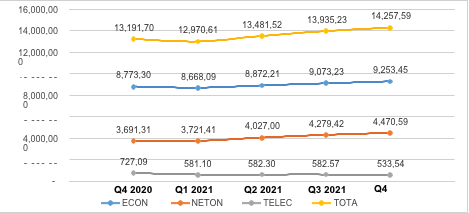
The total number of active mobile subscriptions increased by 2.3% to reach 14,257,590 in the fourth quarter of 2021 from 13,935,233 recorded in the third quarter of 2021. The growth in active subscriptions per operator is shown in table 1 below:
Table 1: Active Mobile Subscriptions
| Operator | 3rd Quarter 2021 | 4th Quarter 2021 | Variance (%) |
| Econet | 9,073,236 | 9,253,453 | 2.0% |
| NetOne | 4,279,427 | 4,470,592 | 4.5% |
| Telecel | 582,570 | 533,545 | -8.4% |
| Total | 13,935,233 | 14,257,590 | 2.3% |
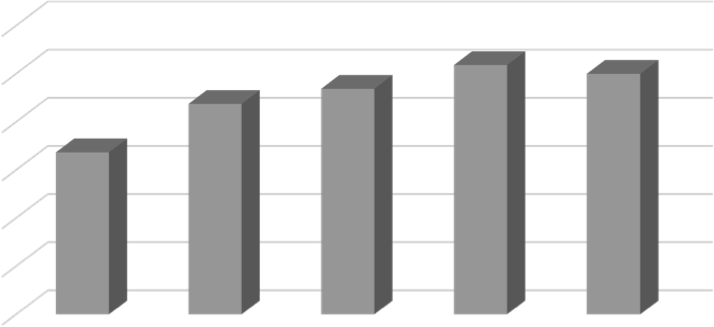
As shown above, all the mobile networks, except Telecel, recorded growth in active subscriptions. The mobile penetration rate was 94.4%; up from 93.5% recorded in the third quarter of 2021. The growth in active subscriptions over the course of the year is shown in Figure 1 below:
Figure 1: Growth in Active Mobile Subscriptions
A quarterly comparison of the market share of active mobile subscriptions is shown in Figure 2 below:
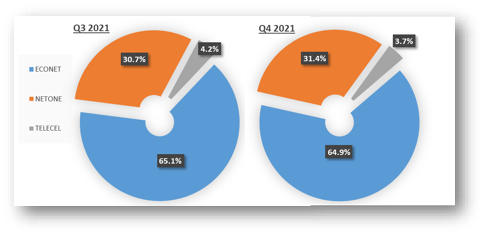
As shown above, Econet and Telecel lost market share by 0.2% and 5%, respectively, whereas NetOne gained market share by 0.7%.
1.1 MOBILE VOICE TRAFFIC
Total mobile voice traffic declined by 14.3% to record 1.8 billion minutes in the fourth quarter of 2021 from 2.1 billion minutes recorded in the third quarter of 2021. The traffic per mobile voice category is shown in table 2 below:
Table 2: Mobile Telephone Traffic
| Traffic Category | 3rd Quarter 2021 | 4th Quarter 2021 | Variance (%) |
| Net on Net | 1,535,197,527 | 1,246,304,596 | -18.8% |
| Mobile to Fixed | 4,712,315 | 4,650,954 | -1.3% |
| Incoming from Fixed | 68,113,011 | 72,460,736 | 6.4% |
| Mobile to Other Mobile (by termination) | 442,889,820 | 422,774,399 | -4.5% |
| Outgoing to IAPs | 2,262,813 | 2,235,053 | -1.2% |
| Incoming from IAPs | 25,549,834 | 26,827,998 | 5.0% |
| TOTAL NATIONAL | 2,078,725,320 | 1,775,253,736 | -14.6% |
| International Incoming | 27,080,048 | 27,675,107 | 2.2% |
| International Outgoing | 6,435,191 | 6,227,437 | -3.2% |
| Inbound Roaming | 852,008 | 1,676,472 | 96.8% |
| Outbound Roaming | 204,313 | 284,844 | 39.4% |
| Total | 2,113,296,880 | 1,811,117,596 | -14.3% |
The decline in mobile voice traffic is attributable to the 56.4% increase in mobile voice tariffs in September 2021. This was the only quarter to record a decline in voice traffic as shown in Figure 3 below:
Figure 3: Mobile Voice Traffic
Despite the decline in other traffic categories, inbound and outbound roaming recorded growth due to the increase in cross-border travel during the period under review. A quarterly comparison of the voice traffic market share, based on the volumes per operator, is shown in Figure 4 below:
Figure 4: Voice Traffic Market Share
As shown above, NetOne gained 2% voice traffic market, Econet lost voice traffic market share by 2%, whilst there was no change in Telecel`s market share.
1.1 MOBILE INTERNET & DATA
Mobile Internet and data traffic declined by 3.5% to record 24,991TB from 25,902TB. All the mobile operators recorded a decline in Internet and data traffic; this is attributable to the 53.4% increase mobile internet and data tariffs in September 2021. As with mobile voice traffic, this was also the only quarter of 2021 to register a decline in mobile Internet and data traffic as shown in Figure 5 below:
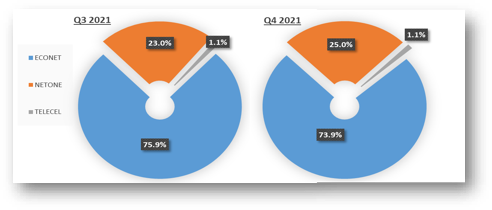
In-bundle data constituted 96.5% of total mobile Internet and data usage, up from 94.6% recorded in the third quarter of 2021 as consumers sought to maximise their utility through promotional bundles. A quarterly comparison of the market share of mobile Internet and data usage is shown in Figure 6 below:

As shown above, NetOne and Telecel lost market share of data by 1.7% and 0.1% respectively, whereas Econet gained market share by 1.8%.
1.1 MOBILE REVENUES, COSTS & INVESTMENT
1.1.1 MOBILE REVENUES
A total of ZW26.2 billion was generated by the three mobile operators in the fourth quarter of 2021, up from ZW19.5 billion recorded in the third quarter of 2021. The revenue contribution of voice service declined, given the huge decline in voice traffic, whereas the revenue contribution of Internet & data services narrowly increased as shown in Figure 7 below:
Figure 7: Mobile Revenue Contribution per Service
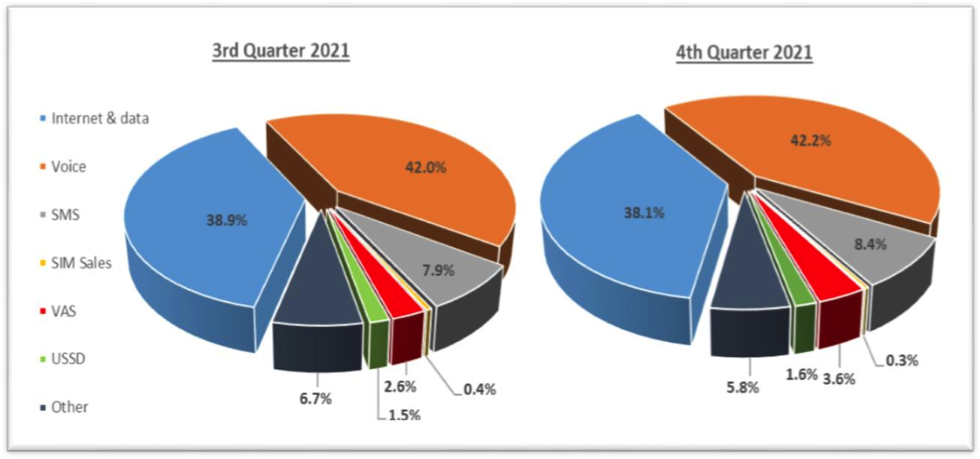 Fig7Operating costs grew by 10.9% in the fourth quarter of 2021, to a record ZWL13.9 billion from ZWL12.5 billion recorded in the third quarter of 2021. Bandwidth costs, staff costs and depreciation continued to be the main cost drivers for the mobile operators. Operating costs have been increasing in line with inflationary pressures in the economy. A total of ZW1.2 billion was invested in the fourth quarter of 2021. This represents a 23.9% decline from ZWL1.6 billion recorded in the third quarter of 2021. The capital expenditure by mobile operators was mainly in national switching, national transmission as well as hardware and software.
1.1 MOBILE TELEPHONY INFRASTRUCTURE
A total of 213 base stations were deployed in the fourth quarter of 2021. The growth in base stations per mobile operator is shown in Table 3 below:
Table 3: Mobile Base Stations
|
Operator |
2G | 3G | LTE | ||||||
| Q3 2021 | Q4 2021 | Net Addition | Q3 2021 | Q4 2021 | Net Addition | Q3 2021 | Q4 2021 | Net Addition | |
| Total | 4,997 | 4,998 | 1 | 2,966 | 2,992 | 26 | 1,136 | 1,322 | 186 |
There was a high number of LTE deployments by Econet and NetOne in the quarter under review. Out of the 186 deployed LTE eNode Bs, 69 were in rural areas vis-à-vis 117 deployed in urban areas. NetOne has partnered with Huawei on a broadband expansion project, hence the 100 deployments by them in the quarter under review. The market share of mobile base stations was as follows:
Figure 8: Market Share of Mobile Base Station Infrastructure
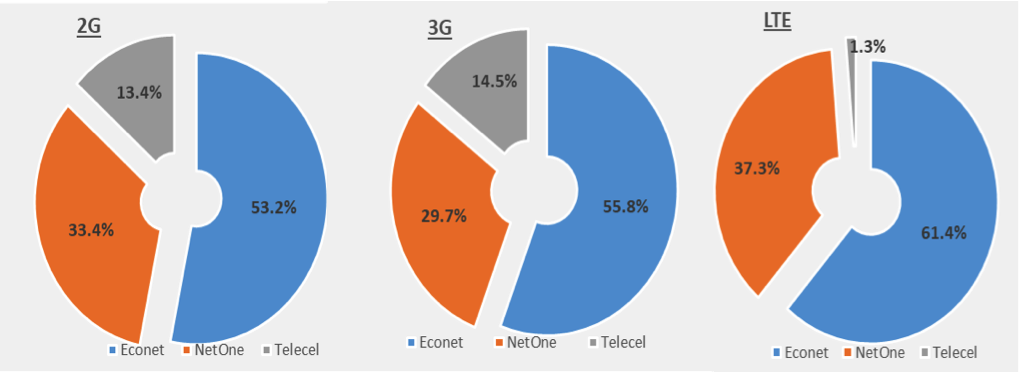
There was no change in the market share of 2G. As for 3G, Telecel and Econet lost market share by 0.1% and 0.4% whereas NetOne gained market share by 0.5%. In terms of LTE, Telecel and Econet lost market share by 0.2% and 2.5% respectively, whereas NetOne gained market share by 2.7% in line with their deployments.
1. FIXED TELEPHONE SERVICE
1.1 SUBSCRIPTIONS
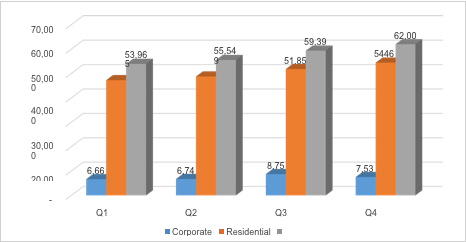
The total number of active fixed telephone lines was 243,421 as at 31 December 2021. This represents a 0.4% decline from 244,316 recorded as at 30 September 2021. The fixed tele density remained at 1.6%. Household subscriptions declined whereas corporate subscriptions increased as shown in table 4 below:
Table 4: Fixed Telephone Subscriptions
| Subscriber category | 3rd Quarter 2021 | 4th Quarter 2021 | % Growth |
| Residential | 144,074 | 143,062 | -0.7% |
| Corporate | 100,242 | 100,359 | 0.1% |
| Total Active | 244,316 | 243,421 | -0.4% |
The quarterly fluctuation in household and corporate fixed telephone subscriptions over the past year is shown in Figure 9 below:
 Fig9Competition with VoIP, especially on the corporate market, has been increasing hence the decline in active subscriptions over the years.
1.1 FIXED NETWORK TRAFFIC
Fixed telephone voice traffic increased by 5.7% to record 92.1 million minutes in the fourth quarter of 2021, from 87.1 million minutes recorded in the third quarter of 2021. The growth in fixed voice traffic per category is shown in table 5 below:
Table 5: Fixed Voice Traffic
| Traffic category | 3rd Quarter 2021 | 4th Quarter 2021 | Variance |
| Net on Net | 8,943,980 | 9,361,835 | 4.7% |
| Outgoing to Mobile | 68,113,011 | 72,460,736 | 6.4% |
| Incoming from Mobile | 4,712,315 | 4,650,954 | -1.3% |
| Incoming from IAPs | 646,062 | 698,257 | 8.1% |
| Outgoing to IAPs | 689,234 | 758,460 | 10.0% |
| Total National Voice Traffic | 83,104,602 | 87,930,242 | 5.8% |
| International Incoming | 2,675,065 | 2,741,596 | 2.5% |
| International Outgoing | 1,349,441 | 1,410,492 | 4.5% |
| Total traffic | 87,129,108 | 92,082,330 | 5.7% |
Unlike mobile voice traffic, fixed voice traffic increased despite the increase in tariffs as the bulk of traffic comes from corporate subscriptions that fairly price inelastic. Incoming traffic from mobile operators was the only category to record a decline as shown in table 9 above.
1.1 FIXED TELEPHONE REVENUES, INVESTMENT & COSTS
The trend of rising revenue amidst rising operating costs has characterised the fixed network as shown in Figure 11 below:
Figure 10: Fixed Network Revenues & Operating Costs
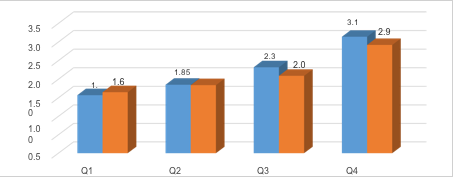 Fig10The growth in mobile network revenue is attributable to the growth in traffic in the period under review. The persistent growth in operating costs is reflective of the inflationary environment.
1. DATA & INTERNET SERVICES
1.1 SUBSCRIPTIONS
The total number of active Internet and data subscriptions as of 31 December 2021 was 9,526,421. This represents a 2.3% growth from 9,316,180 recorded as of 30 September 2021. The growth in active data and Internet subscriptions by technology is shown in table 6 below:
Table 6: Active Internet & Data Subscriptions
| Technology | 3rd Quarter 2021 | 4th Quarter 2021 | Variance (%) |
| 3G/HSDPA/LTE | 9,122,462 | 9,331,088 | 2.3% |
| Leased Lines | 2,440 | 2,446 | 0.2% |
| DSL | 112,383 | 111,701 | -0.6% |
| WiMAX | 5,441 | 6,185 | 13.7% |
| CDMA | 11,901 | 10,344 | -13.1% |
| VSAT | 2,159 | 2,653 | 22.9% |
| Active Fibre Subscriptions | 59,394 | 62,004 | 4.4% |
| Total | 9,316,180 | 9,526,421 | 2.3% |
The Internet penetration rate increased by 0.5% to reach 63.1% from 62.6% recorded in the third quarter of 2021 because of the growth in active Internet and data subscriptions. VSAT had considerable growth in active subscriptions as it has become the preferred medium for connecting educational and health institutions in remote areas. CDMA and DSL subscriptions were the only two categories to record a decline. CDMA subscriptions have been showing a declining trend over the past year. Corporate as well as household Fibre subscriptions have been consistently increasing. The growth in Fibre subscriptions by type of subscription over the course of the year is shown in Figure 11 below:
Figure 11: Active Fibre Subscriptions
1.1 INTERNATIONAL INTERNET CONNECTIVITY
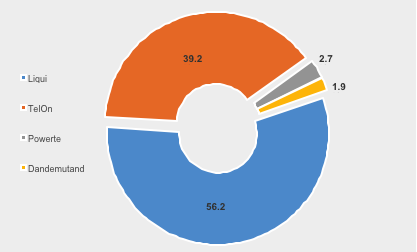
Equipped international Internet bandwidth capacity increased by 16.4% to reach 496,916Mbps from 426,916Mbps as shown in table 7 below:
Table 7: Equipped International Internet Bandwidth Capacity (Mbps)
| 3rd Quarter 2021 | 4th Quarter 2021 | Variance (%) | |
| Liquid | 330,000 | 400,000 | 21.2% |
| TelOne | 87,500 | 87,500 | 0.0% |
| Powertel | 5,000 | 5,000 | 0.0% |
| Dandemutande | 4,416 | 4,416 | 0.0% |
| Total | 426,916 | 496,916 | 16.4% |
The growth in the total equipped capacity is attributable to Liquid`s expansion as shown above. The change in the market share of equipped international Internet bandwidth capacity, owing to the expansion by Liquid is shown in figure 12 below:
As shown above, Liquid gained market share by 3.2%, whereas all the other Internet Access Providers lost market share of equipped international Internet bandwidth capacity. TelOne lost 2.9%, Powertel lost 0.2% and Dandemutande also lost 0.1%. There was an increase in used international incoming bandwidth capacity, but as shown in table 8 below:
Table 8: Used International Internet Bandwidth Capacity
| 3rd Quarter 2021 | 4th Quarter 2021 | Variance (%) | |
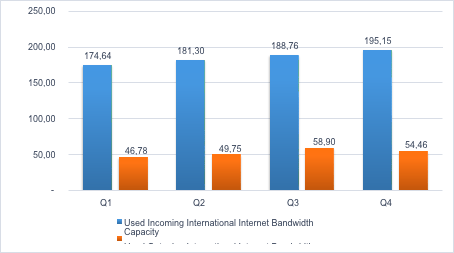
| Incoming | 188,768 | 195,158 | 3.4% |
| Outgoing | 58,902 | 54,464 | -7.5% |
The decline in outgoing international internet bandwidth capacity implies a decline in local online content accessed outside our borders in the quarter under review. The growth in used incoming and outgoing international Internet bandwidth capacity over the past year is shown in Figure 13 below:
Figure 13: International Internet Bandwidth Capacity
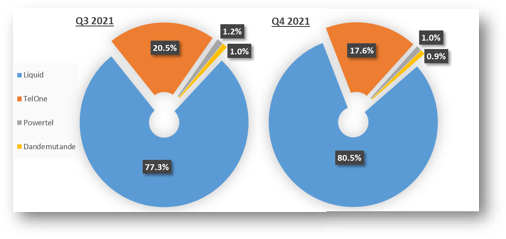
Used international Internet bandwidth capacity is expected to continue growing as the number of users increases and the scope of services widens due to adoption of Internet of Things. The market share of used international Internet bandwidth capacity was as follows:
Figure 14: Market Share of Used International Internet Bandwidth Capacity
A comparison with the previous quarter`s market share shows that Liquid gained market share by 0.1%; TelOne lost 0.1% whereas the market shares of Powertel and Dandemutande remained unchanged.
1.1 IAP REVENUES, OPERATING COSTS & INVESTMENT
The growth in revenue, operating costs and capital expenditure by Internet Access Providers is shown in table 9 below:
Table 9: IAP Revenues, Operating Costs (ZWL)
| 3rd Quarter 2021 | 4th Quarter 2021 | Variance (%) | |
| Revenue | 7,266,119,186 | 9,284,401,505 | 27.8% |
| Operating Costs | 5,126,047,336 | 5,505,662,036 | 7.4% |
| Capital Expenditure | 174,379,432 | 335,779,094 | 81.1% |
The growth in revenue is attributable to the increase in Internet and data traffic. A huge growth in capital expenditure of 81.1% was recorded in the quarter under review. The bulk of the investment was in Fibre.
1. POSTAL & COURIER
1.1 POSTAL & COURIER VOLUMES
Total postal and courier volumes declined by 11.7% to record 642,432 items in the fourth quarter of 2021, from 732,303 items recorded in the third quarter of 2021. Domestic courier volumes increased, whereas domestic postal letters and international courier recorded a decline as shown in table 10 below:
Table 10: Postal and Courier Volumes
|
3rd Quarter 2021 |
4th Quarter 2021 |
% Growth |
|
| Domestic postal letters | 372,919 | 301,189 | -19.2% |
| Domestic courier | 123,695 | 126,866 | 2.6% |
| International incoming courier | 191,942 | 175,654 | -8.5% |
| International outgoing courier | 38,747 | 38,723 | -0.1% |
| Total Postal & Courier | 727,303 | 642,432 | -11.7% |
Domestic postal letters recorded the biggest decline in volumes as shown above. The movement in postal and courier volumes over the course of the year is shown in Figure 15 below:
Figure 15: Postal & Courier Volumes
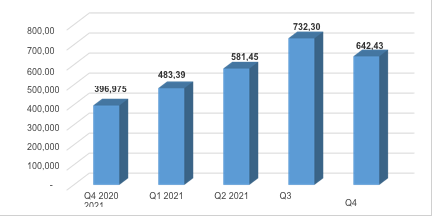
As shown above, this was the only quarter of 2021 to record a decline in volumes, following a period of recovery from COVID-19 mail channelling setbacks.
1.1 POSTAL & COURIER REVENUES, COSTS & INVESTMENT
Total revenue generated by the postal and courier sector increased by 3.1% to record ZWL468.3 million in the fourth quarter of 2021, from ZWL454.1 million recorded in the third quarter of 2021. Operating costs grew by an even higher margin of 9.7% to record ZWL401.9 million from ZWL366.3 million as shown in table 11 below:
Table 11: Postal & Courier Revenues, Costs & Investment
|
3rd Quarter 2021 |
4th Quarter 2021 |
Variance |
|
| REVENUES | 454,097,831 | 468,262,927 | 3.1% |
| OPERATING COSTS | 366,338,565 | 401,935,022 | 9.7% |
| INVESTMENT | 6,268,461 | 6,857,881 | 9.4% |
The growth in operating costs is attributable to the inflationary economic environment. Administration costs, line haul costs and transit charges continue to constitute the bulk of postal and courier operating costs. The capital expenditure was mainly on delivery vehicles.
5. OUTLOOK
The year 2021 was characterized by increased reliance on work – from – home, e-learning, e- conferencing resulting from the COVID – 19 effects. As such, there was an increased demand for online or Internet connection. Increased demand for Internet connection as well as the dynamic developments and fast-changing technological advances added pressure to the sector, in terms of service delivery. Liquidity constraints coupled with the sector’s in ability to have foreign direct investment, meant much of investment was financed by retained income. Investment in the sector was, therefore, depressed given the sector’s dependency on foreign equipment for new infrastructure and maintenance. Deteriorating exchange rate also affected the purchasing power of both consumers and service providers in real terms.
In 2022, the industry, is expected to focus on more innovation to deal with situations such as pandemics as well as emerging technologies such as the Internet of Things, Machine to Machine learning, Artificial Intelligence, and Distributed Ledger amongst others.
The various economic reforms by the Government of Zimbabwe have potential to positively transform the economy in 2022. However, as with the previous year, cost escalations are expected to continue, for as long as the dual currency system remains in practice. Hence, the intricacy of balancing service affordability and operator viability remains a priority for the regulator to address, whilst fiscal interventions may be necessary. It is hoped that the recent liberalisation of the foreign currency market will improve foreign currency availability to the sector for investment in network expansion and upgrades for inclusive, high-quality service delivery.